SPLUNK – the animal is unknown and where it lives

With centralized management of distributed systems, the question arises of monitoring these systems, preferably in real time, with the possibility of prompt intervention in the event of an incident.
This problem can be effectively solved by centralizing the collection, storage and processing of logs of monitored systems. Also, centralized storage of logs allows you to restore the course of events even in the event of complete destruction of the target system, including event logs.
Today we will talk about connecting Linux-based OS systems in simple (I hope) words.
The complex is based on the current version 9.0.5 Splunk server, which already successfully receives data from Windows and other systems. When installing the server, a separate port 39801 was assigned, on which the listener service will receive all data from agents.
Before you start connecting, you should decide exactly how to collect data from servers, and how you will then process it. Build yourself a chain from an event that could hypothetically happen on the server that you want to track, and to the reaction to this event.
Let's take as an example a simple incident: elevating (or attempting to elevate) a user's rights from “normal” to root in OS LINUX. The chain will be like this:
- The user successfully (or unsuccessfully) elevated his rights to root by entering the sudo-i command.
- The event was recorded in the server logs (client - in relation to the Splunk server)
- Event is sent from client to Splunk server
- On the Splunk server, the event goes to a specific index, where it will be processed and, most importantly, stored for retrospective analysis.
Additionally, for some events, they can be normalized on the client side, but it is better that they reach the server in a pure, uncomplicated form. Especially critical ones.
So, the event occurred, and it should be reflected in the client logs. The two main methods are collection of native LINUX logs and collection by the auditd daemon. Both methods have their own differences in setup and processing.
- As usual, logs are collected in the /var/log/ folder. Perhaps this will be quite enough, but it depends on what services and directories you need to monitor. We will try to monitor the entire folder and see what data will be included in the index automatically.
- You can install auditd - this daemon will collect all events into one file. Auditd has its own configuration file, and you can specify what and how it will collect. The disadvantage of auditd can be considered an excessive load on the system, but this can be regulated either by its fine settings or by increasing the amount of memory. By default, the file is created at /var/log/audit/audit.log
Please take this point into account if you configure monitoring of the /var/log/ folder and the auditd daemon log at the same time, so that you do not have duplicate event records.
Having decided what and how we will collect, we can move on to the stage of transferring this information to the server. To do this, we will use the universal service from Splunk – Splunk Forwarder. For various systems, it can be downloaded from the link: https://www.splunk.com/en_us/download/universal-forwarder.html#tabs/linux (registration required).
The task of the forwarder is to transfer information from point A to point B, where point A is the log file, and point B is the Splunk server. In addition, the forwarder can transmit data “on a chain”: for example, from several servers in the same network segment that do not have direct access to the Splunk server, client forwarders transmit data to the consolidating forwarder, and it in turn transmits to the server separately, a dedicated channel specifically for it, to a different subnet.
Installing a forwarder on a monitored server begins with creating an individual user and group under which the forwarder will be launched. By default this is the splunk user and the splunk group.
Create a user and group:
#useradd -m splunk
#groupadd splunk
Create a home directory for the forwarder:
#export SPLUNK_HOME="/opt/splunkforwarder"
#mkdir $SPLUNK_HOME
Unpack the downloaded distribution in the .tgz archive into the /opt/splunkforwarder/ folder and assign the new user as the owner:
#chown -R splunk:splunk $SPLUNK_HOME
Switch to new splunk user or any other unprivileged user and go to /opt/splunkforwarder/bin/ folder and find splunk script.
Run the script for the first time, during which it will install the necessary components
$sudo $SPLUNK_HOME/bin/splunk start --accept-license
In the future, this script will be needed to restart the forwarder; other settings are specified only in the configuration files.
./splunk stop – stop the service
./splunk start – start the service
./splunk status – check current status
After installation, three folders with settings that interest us will appear in the /opt/splunkforwarder/etc/system/ folder
/default – this folder contains all configuration files that operate by default. They cannot be changed.
/README – detailed description of each parameter in each file.
/local is the folder we are interested in. All configuration files placed in this folder take precedence over the default settings.
To simply transfer data from the client to the Splunk server, we need two files that define “what” to collect and “where” to send.
outputs.conf – specifies the address of the target server or node forwarder.
For one server the following configuration is sufficient:
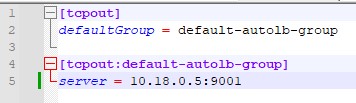
[tcpout]
defaultGroup = default-autolb-group
[tcpout:default-autolb-group]
server = 10.10.10.5: 39801
Despite the fact that there is one server and one client, you must first specify the default group to which the client will belong. When there are several clients, you need to indicate the same group.
Be sure to check if the port you specified is visible from the client machine (for example, using the command: $ telnet 10.10.10.5 39801).
Inputs.conf – lists what exactly to collect and what index to send to.
First, we indicate the configuration that will be considered the default
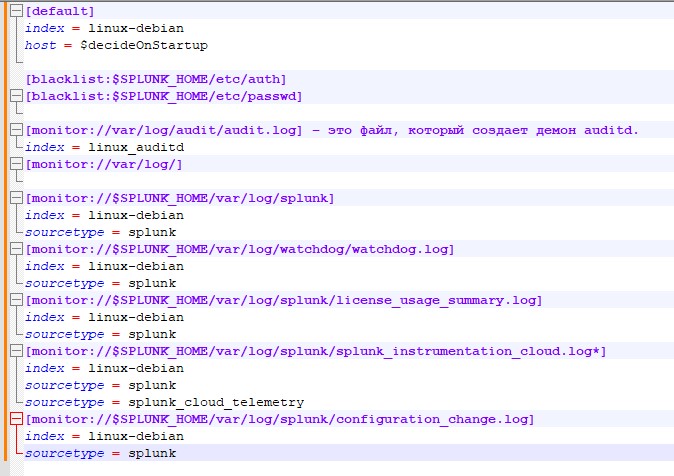
[default]
index = linux-debian – index where the data will go unless otherwise specified.
host = $decideOnStartup – the name of this server, as it will subsequently be displayed in the slack logs. An important point is that if you leave the value $decideOnStartup, then the server name that it received during installation will be taken. But in the case of virtualized servers, and if they were created by cloning, then you will get the same host names, which will be mixed in the index. You should also not be tied to the IP address of the machine - many events are not tied to the address and do not display it in any way. It would be much safer to manually specify the server name as you want to see its logs.
We will indicate a blacklist of files, their locations that do not need to be monitored
[blacklist:$SPLUNK_HOME/etc/auth]
[blacklist:$SPLUNK_HOME/etc/passwd]
We indicate what needs to be monitored and where to add it, in what index:
[monitor://var/log/audit/audit .log] is the file that the auditd daemon creates.
index = linux_auditd – please note that a separate index has been created for it on the server. If this parameter is not specified, the linux-debian index specified in the [default] at the beginning of the file will be selected.
[monitor://var/log /] – this item indicates that you need to monitor the entire /var/log/ folder. Since the additional index parameter is not specified, the data will end up in index = linux-debian by default
Please note that in this configuration the file /var/log/audit/audit.log will be re-monitored, and information from it will “get” into two indexes: both linux-debian and linux_auditd
Don’t forget about monitoring the forwarder itself, because if it is disabled, we will stop receiving system logs:
[monitor://$SPLUNK_HOME/var/log/splunk]
index = linux-debian
sourcetype = splunk
[monitor://$SPLUNK_HOME/var/log/watchdog/watchdog .log]
index = linux-debian
sourcetype = splunk
[monitor://$SPLUNK_HOME/var/log/splunk/license_usage_summary .log]
index = linux-debian
sourcetype = splunk
[monitor://$SPLUNK_HOME/var/log/splunk/splunk_instrumentation_cloud .log*]
index = linux-debian
sourcetype = splunk
sourcetype = splunk_cloud_telemetry
[monitor://$SPLUNK_HOME/var/log/splunk/configuration_change .log]
index = linux-debian
sourcetype = splunk
In this case, when adding the variable sourcetype = splunk, information about the operation of the forwarder will go into the general index, but the data type will be specified as splunk. This will be useful for subsequent data analysis and query building.
It is recommended to monitor the following directories and sources:
/etc
/var/log
/home/*/.bash_history
/root/.bash_history
/var/adm
/Library/Logs
After making changes to any configuration files, you must restart the forwarder for them to take effect.
./splunk stop – stop the service
./splunk start – start the service
During the setup process, it is recommended to enable the request index="linux-debian" or index="linux_auditd" on the server and set the time period to REAL-TIME - 5 minute window. You will immediately see the data that entered the index after the forwarder was restarted - either that it changed, or that it began to arrive on the server at all.
If everything was done correctly, then after the final start of the forwareder service in the Splunk server itself we will see new indexes “come to life”:
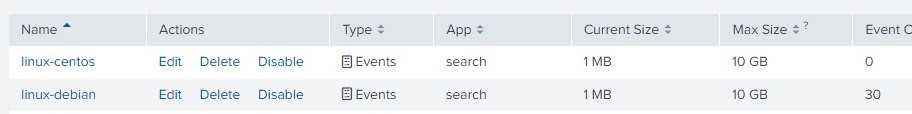
And now you can use the full potential of the Splunk product to build a system for monitoring events and identifying incidents.
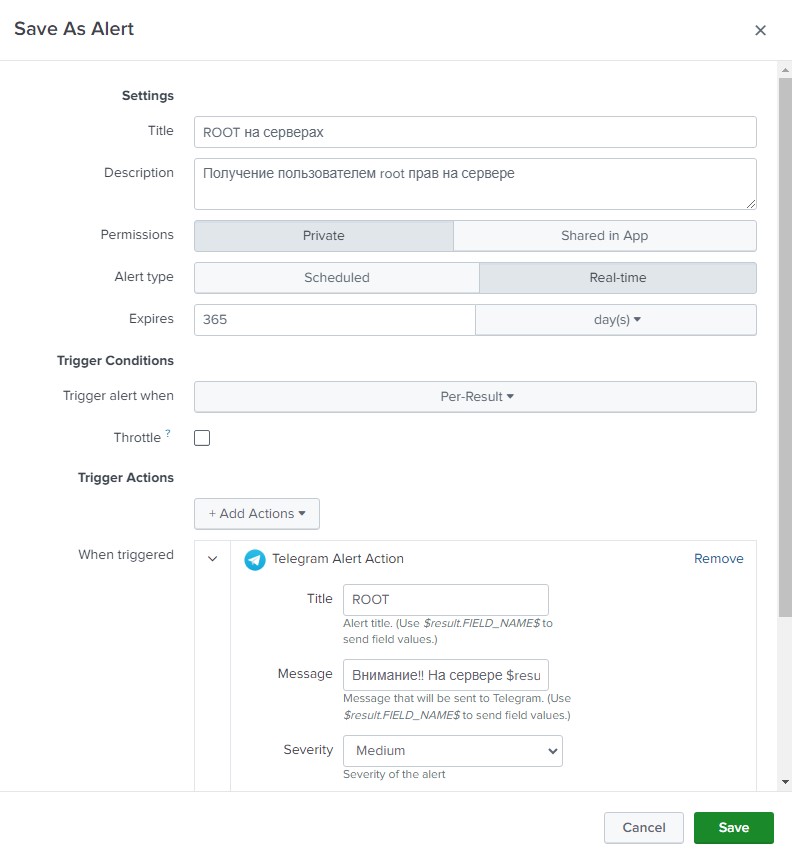
For example, where the article actually began - the event of the user obtaining root rights. To do this, we write a simple query, taking into account the index where we are uploading the data.
index="linux_auditd" acct=root audit_description="User session start"| table UID host
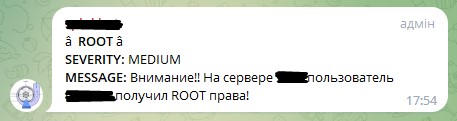
This query will return all events that started a session with root rights and display the user name and host name on which this happened. We save this request as an alert, let’s call it, for example, “ROOT on servers.” We indicate the alert type “Real-time” and the duration of 365 days (yes, we must remember that it will turn off after a year). Let's add an action that needs to be performed when an event occurs - we will send messages in telegrams. In the message field, enter “Attention!! On the server $result.host$, user $result.UID$ has received ROOT rights!” - this will generate the necessary message for us from the received fields.
If everything is correct, then messages should arrive in telegrams with a delay of approximately 5-8 seconds.
By analogy, you can create another alert that will trigger not when the user successfully obtains rights, but when he was unable to obtain them, although he tried. To do this, let's make the following request:
index="linux_auditd" action=failure type=USER_AUTH | table UID host addr
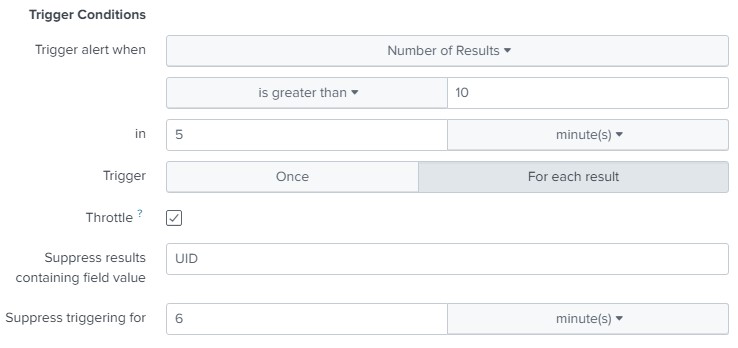
This request will give us errors when authorizing the user. Let's make an alert out of it, but with the difference from the previous one that it will not be triggered by a one-time event (maybe the admin just didn’t hit the keyboard the first time), but when 10 such events occur in a period of 5 minutes. We also take into account that after the alert is triggered, it must temporarily turn off for 6 minutes so as not to recalculate the values for the last 5 minutes that it has already calculated.
In this case, you will receive the following message in telegram:
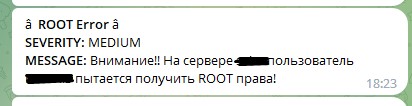
In this example, we take into account the number of repetitions of the UID field value within 5 minutes, but you can set up an alert simply for the number of errors, assuming that the password is selected not for one account, but for different accounts, although most often the password is selected for the root user or another previously known user.
You can also customize other reactions. For example, if there are 1000 errors within 5 minutes, execute a script that will add or enable a firewall rule that isolates the attacking host. The IP of this host will be returned to us by the addr variable from our request.
Thus, dear readers, we have figured out that the Splunk software solution is a very powerful tool for centralized collection, storage and processing of OS LINUX logs.
We studied how to install, configure and manage Splunk’om.
Using LINUX-daemon auditd as an example, we learned how to deliver events to the Splunk index, and observed how Splunk alerts are configured and sent to an external channel (Telegram).
To be continued!